Magnetics: Description of Modules
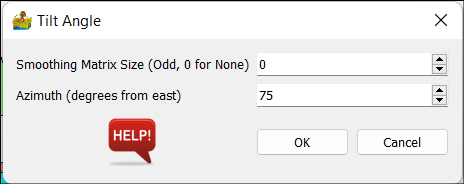
Tilt Angle Calculation
This calculates the tilt angle of the data (Cooper and Cowan 2006). It allows for smoothing as well. It outputs the Standard tilt angle, Hyperbolic tilt angle, second order tilt angle, Tilt Based Directional Derivative and the Total Derivative.
Options:
Smoothing Matrix - an odd matrix used to smooth the data
Azimuth - This is the direction of the tilt angle, in degrees from east. It is used in the tilt based directional derivative.
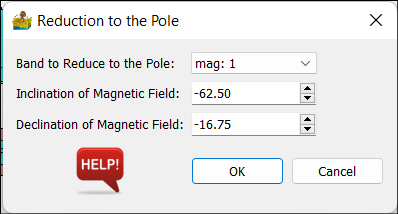
Reduction to the Pole
This is a reduction to the pole routine for Magnetic data. The input is a raster dataset.
Options:
Band to Reduce to the Pole - This should be magnetic data.
Inclination - Magnetic inclination at the date of the survey.
Declination - Magnetic declination at the date of the survey.
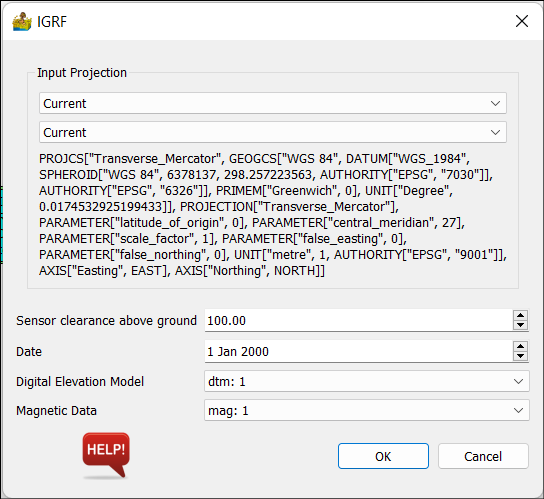
Calculate IGRF Corrected Data
This calculates IGRF corrected version of the magnetic data. It requires, as input, a magnetic dataset for an area as well as a digital elevation model. Since the IGRF correction relates to latitude and longitude, the projection of the input dataset is required. The IGRF corrected is a translated version of the correction supplied at: http://www.ngdc.noaa.gov/IAGA/vmod/igrf.html
Input Projection
The choice of projection is obtained through drop boxes.
IGRF Options
Sensor Clearance above ground - This is the height, in meters, of the sensor measuring the magnetic field, above the ground.
Date - This is the survey date. The IGRF field changes depending on when the magnetic data was collected, so the survey date must be taken into account.
Digital Elevation Model - raster grid of the terrain in height above sea level.
Magnetic Data - raster grid of the magnetic data to be corrected.
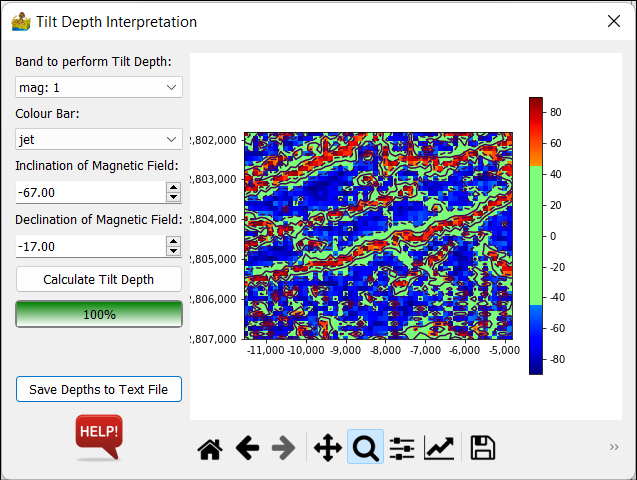
Tilt Depth Interpretation
The tilt depth interpretation (Salem et al 2007) is a technique for calculating depths to vertical sided bodies from the magnetic tilt angle. As such it required magnetic data as input.
This works on the principle that the distance between the -45 degree and 45 degree tilt angle is twice the distance to the body. This zone of interest is highlighted on the map.
What is important to note is that this technique works best with data which has been reduced to the pole. For this reason, RTP has been built into the module.
The results can be output to a text file, with columns x, y, id and depth. In this case, id refers to a contour id where the tilt angle is equal to zero.
Options:
Band to perform tilt depth - this should be magnetic data
Colour Bar - colours used to display the tilt angle data.
Inclination of Magnetic Field - inclination of the field at the location and date of survey.
Declination of Magnetic Field - declination of the field at the location and date of survey.
Calculate Tilt Depth - used to recalculate after changing inclination or declination.
Save depths to text file.