

Magnetotellurics: Description of Modules
MT processing makes use of the MTpy library.
Import EDI Data
Used to import EDI data into PyGMI. Note that more than one file can be selected at a time.
Import LEMI-417 data to point data
Used to import LEMI-417 data into PyGMI point/line data format.
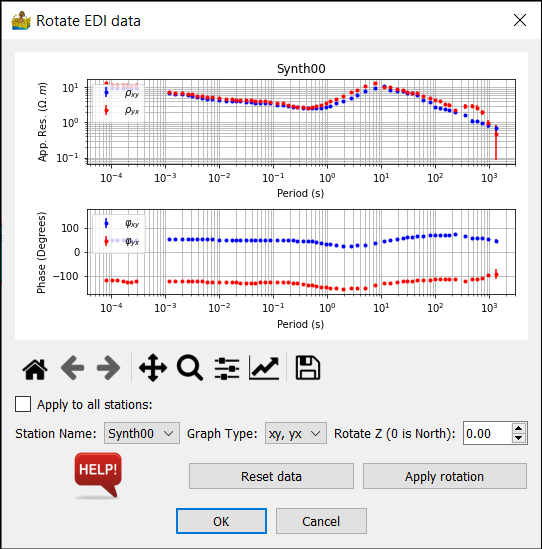
Rotate EDI Data
This module allows for the display and rotation of EDI data. Apparent resistivity and phase versus period are both displayed as graphs.
Options are as follows:
Apply to all stations - Check this setting to apply the selected rotation to all stations.
Station Name - Used to select a station, which is then displayed in the graph.
Graph Type - can be either ‘xy, yx’ or ‘xx, yy’
Rotate Z - Rotation angle, where 0 degrees is North.
Reset Data - restores data for pre-rotation status.
Apply Rotation - rotate the data using the value in the ‘Rotate Z’ option.
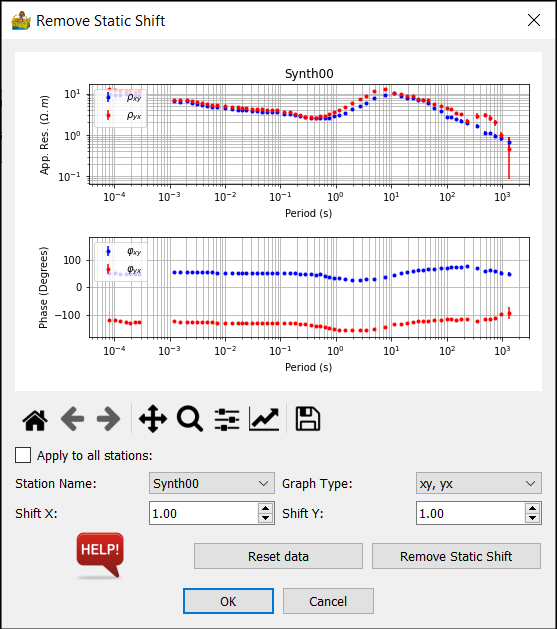
Remove Static Shift
This module allows for the static shift correction to EDI data. Apparent resistivity and phase versus period are both displayed as graphs.
Options are as follows:
Apply to all stations - Check this setting to apply the selected rotation to all stations.
Station Name - Used to select a station, which is then displayed in the graph.
Graph Type - can be either ‘xy, yx’ or ‘xx, yy’
Shift X - correction to X.
Shift Y - correction to Y.
Reset Data - restores data for pre-shifted status.
Remove Static Shift - applies the correction.
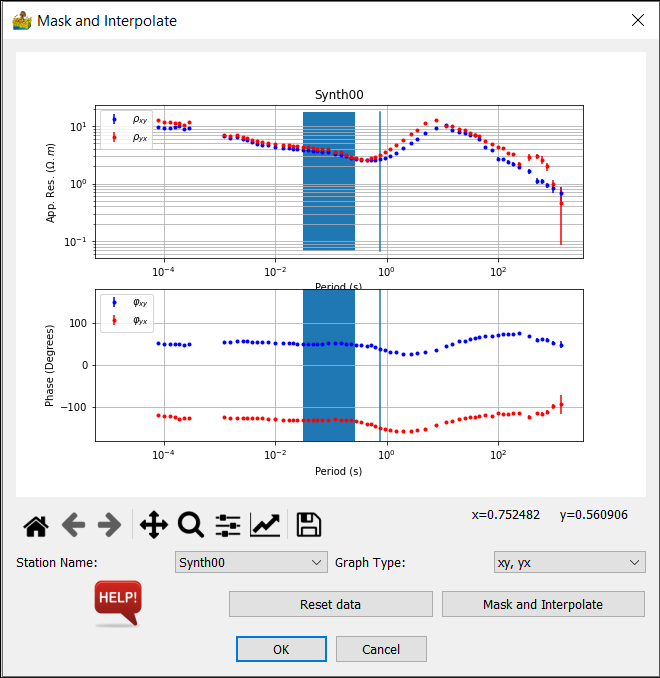
Mask and Interpolate
This module allows for the display and editing of EDI data. A data range to be edited is selected on the graphs using the mouse. Selected data is masked out, and then interpolated versions replace the masked section. Apparent resistivity and phase versus period are both displayed as graphs.
Options are as follows:
Station Name - Used to select a station, which is then displayed in the graph.
Graph Type - can be either ‘xy, yx’ or ‘xx, yy’
Reset Data - restores data for pre-edited status.
Mask and Interpolate - masks the selected data and interpolates across the masked area.
Occam 1D Inversion
MT processing makes use of Occam 1D inversion code. This module applies Occam 1D inversion to EDI data. Multiple solutions are generated, and a slider is used to view each solution in order to select the appropriate solution. Apparent resistivity and phase versus period are both displayed as graphs. A third graph showing depth versus layer resistivity is also shown.
OCCAM1DCSEM requires three input files: IterationFile, ModelFile, and DataFile (all of which are generated by MTpy automatically). A directory labelled by the mode (see options below) is created as a subdirectory to the input EDI file directory and contains these files. This new directory contains the Occam 1D iteration (.iter) and output response (.resp) files. Full descriptions can be found in here.
Options are as follows:
Station Name - Used to select a station, which is then displayed in the graph.
Mode - can be TE, TM or DET
Resistivity Error bar - either specified as ‘data’ or in units of %
Phase Error bar - either specified as ‘data’ or in units of %
Resistivity Error Floor - in units of %
Phase Error Floor - in degrees
Height of air layer - in units of metres
Bottom of model - in units of metres
Depth of target to investigate - in units of metres
Depth of first layer - in units of metres
Number of layers - refers to model layers
Maximum iterations - maximum number of iterations Occam uses to compute
Target RMS - target RMS misfit.
Remove resistivity/phase values out of 1st/3rd quadrant
Invert Station - used to get Occam 1D to invert the current station
