

Seismology: Context Menu
The seismology context menus are available for modules which have seismology output data. Output data is only available on green modules. To access the context menu, simply right-click a green module.
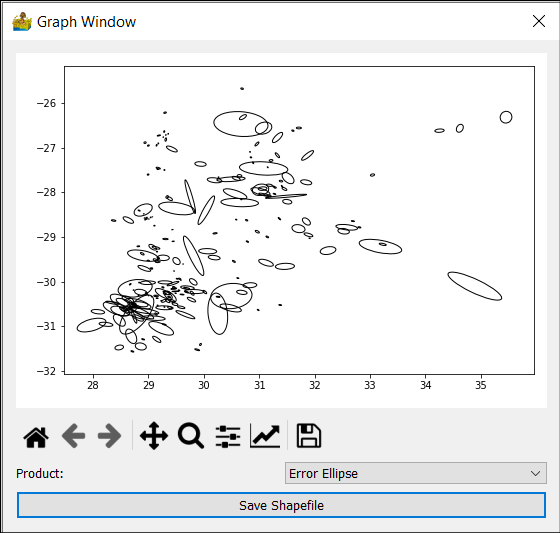
Show QC Plots
A series of graph routines were developed to assess the SEISAN catalogue data. The following graphs are available:
Events by Hour - Histogram
Events by Month - Histogram
Events by Year - Histogram
Number of stations - Histogram
RMS of time residuals - Histogram
ML vs Time - Scatter plot
ML vs Year - Scatter plot
b-value - Cumulative histogram and line
Error Ellipse
Error Ellipse (No depth errors)
GAP - Histogram
Longitude Error - Histogram
Latitude Error - Histogram
P-Phase Residuals - Histogram
S-Phase Residuals - Histogram
ML Residual - Plot with error bars
Time Residual - Plot with error bars
Wadati plot - Line and points
Export SEISAN Data
This option allows for the export of seismology data in NORDIC format.
Export to CSV
The entire SEISAN database can be exported directly to CSV format.
Export Summary to CSV
A summary of the events in the database can be exported here.