

Show OBJ, VRC, NCE, XBI Graphs#
This information relates to comparisons between cluster analysis runs over different numbers of classes. If, for example, a crisp cluster run has a minimum of 5 and maximum of 7 classes, then three solutions are produced; one with 5, one with 6 and one with 7 classes. This context menu displays information in graphical form which can assist in determining the optimal number of classes present in the data.
One graph is produced for Cluster Analysis, Crisp Clustering and Fuzzy Clustering results:
Variance Ratio Criterion (VRC) as a 2D graph. This was proposed by Calinski and Harabasz (1974) and is also called the Calinski–Harabasz index (CHI). In simple terms it takes the ratio of the distance between clusters and the distance between a point in a cluster and the cluster centre. The latter is an indication of dispersion within the cluster. Ideally the clusters must be well separated (large numerator) and compact (small denominator) which means the maximum VCR corresponds to the best number of clusters.
The following additional graphs are produced for Fuzzy Clustering results:
Objective Function (OBJ) as a 3D graph that shows the number of iterations to convergence to a solution for each number of clusters.
Normalized Class Entropy (NCE) as a 2D graph. This gives an indication of the degree of disorder in the system, with smaller values for separated clusters and large values for overlapping clusters (Paasche et al., 2006). The minimum NCE will therefore point to the optimal number of classes.
Xie-Beni Index (XBI) as a 2D graph. The index calculates the ratio between the objective function and the distance between clusters. The minimum XBI corresponds to the optimal number of classes (Paasche and Eberle, 2009).
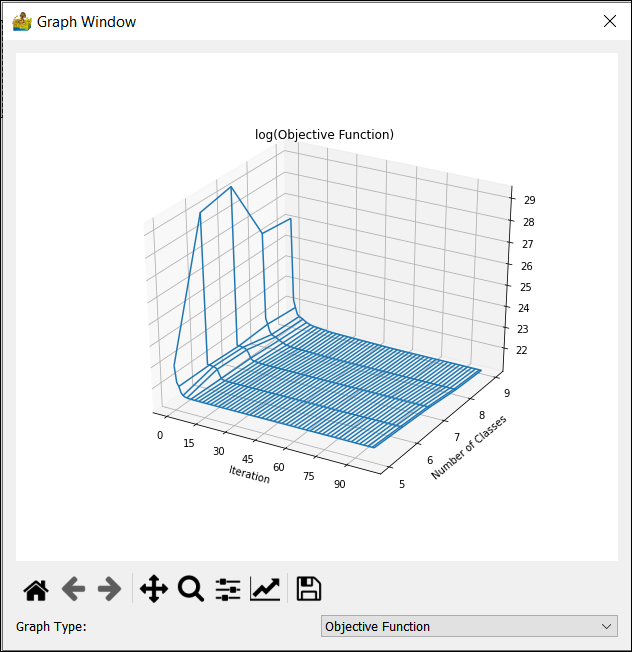
Graphs showing the validity criteria used to select the optimum number of classes. (a) Variance Ratio Criterion; (b) Objective function; (c) Normalised Class Entropy; (d) Xie-Beni Index.#
References#
Caliñski, T. and Harabasz, J. 1974. A Dendrite Method for Cluster Analysis. Communications in Statistics, 3, 1–27, https://doi.org/10.1080/03610927408827101.
Paasche, H. and Eberle, D.G. 2009. Rapid integration of large airborne geophysical data suites using a fuzzy partitioning cluster algorithm: a tool for geological mapping and mineral exploration targeting. Exploration Geophysics, 40, 277–287, https://doi.org/10.1071/EG08028.
Paasche, H., Tronicke, J., Holliger, K., Green, A.G. and Maurer, H. 2006. Integration of diverse physical-property models: Subsurface zonation and petrophysical parameter estimation based on fuzzy c-means cluster analyses. Geophysics, 71, H33–H44, https://doi.org/10.1190/1.2192927.