

Show Surface#
This shows a simple surface formed by the data. Change the view angle by holding down the left mouse button and dragging the mouse around. Dragging the mouse while holding down the right mouse button zooms in and out of the surface graph.
The options on this interface are:
Bands - Select the band to be displayed.
Colormap - Select a colormap for the data display. The user can choose between Viridis, Jet, Gray and Terrain.
Vertical exaggeration slider - Used to enhance vertical features.
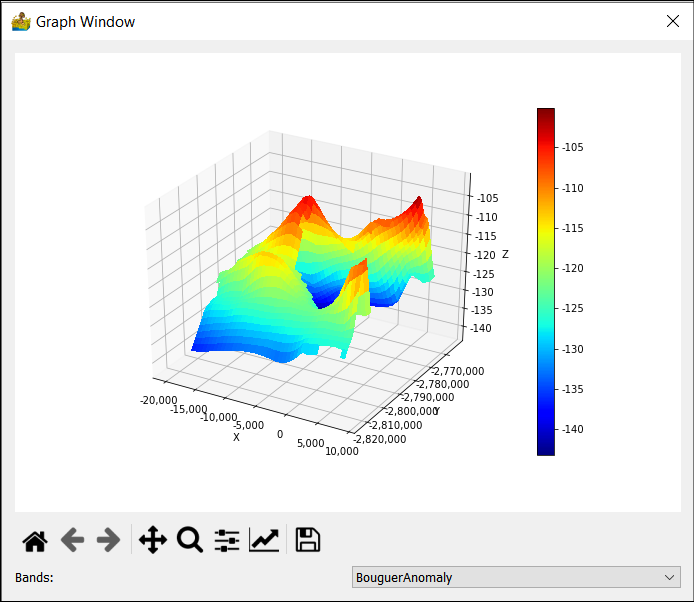
Show Surface interface.#