

Show Graphs#
This displays graphs of the station data.
The apparent resistivity versus period for the selected elements.
Phase versus period for the selected elements.
Tipper magnitude versus period for the selected elements.
Tipper angle versus period for the selected elements.
Station Name - If data for multiple stations were imported the dropdown list can be used to select a specific station
Graph Type - This can be either ‘xy, yx’ or ‘xx, yy’.
Values for a point in any of the graphs over which the mouse pointer is hovering.
Standard image display settings that allow the user to zoom into specific areas of the image, move the zoomed in area around, return to the full image, save the image, etc.
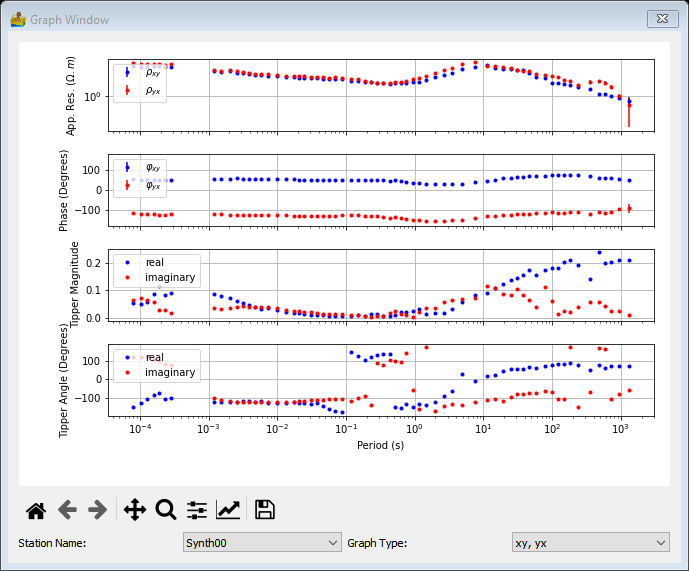
Graphs displayed when selecting Show Graphs in the MT context menu. The coordinates in the bottom-right corner displays the period and value of any point the user hovers over with the mouse pointer, in this case a point in the Tipper Angle.#