

Mask and Interpolate#
This module allows for the display and editing of EDI data. A data range to be edited is selected on the graphs using the mouse. Selected data is masked out and replaced by interpolated versions values.
The interface for this module has the following aspects and options:
Windows showing the apparent resistivity and phase versus period for the selected station.
Station Name - If data for multiple stations were imported the dropdown list can be used to select a specific station.
Graph Type - This can be either ‘xy, yx’ or ‘xx, yy’.
Mask and Interpolate - Select a window of data to be masked by left clicking on any of the graphs and dragging the mouse. The selected data will be coloured blue. Apply the masking and interpolation routine across the selected area.
Reset data - Restores data for pre-edited status.
Standard image display settings that allow the user to zoom into specific areas of the image, move the zoomed in area around, return to the full image, save the image, etc.
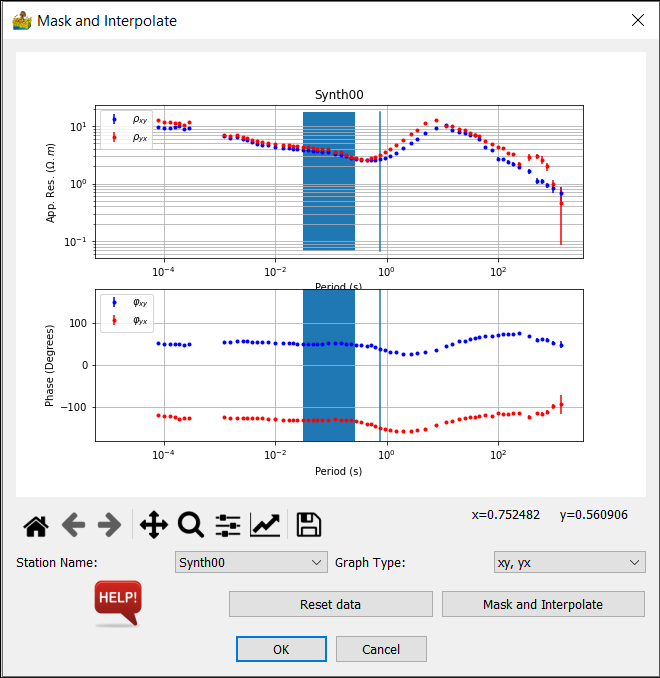
Mask and Interpolate interface. The blue areas on the graphs show the data that will be masked.#