

Show Hexbin Plot#
A hexbin plot is a type of scatter gram, where the points on the scatter gram are binned, and the amplitude of the bins are shown in colour. The scale of the amplitudes is given in log in order to increase the amount of information on the plot.
The options on this interface are:
X Band - Select the band to show on the x-axis.
Y Band - Select the band to show on the y-axis.
The values of the bands assigned to X and Y at the cursor locality.
Standard image display setting that allows the user to zoom into specific areas of the image, move the zoomed in area around, return to the full image, save the image with the colour bar, etc.
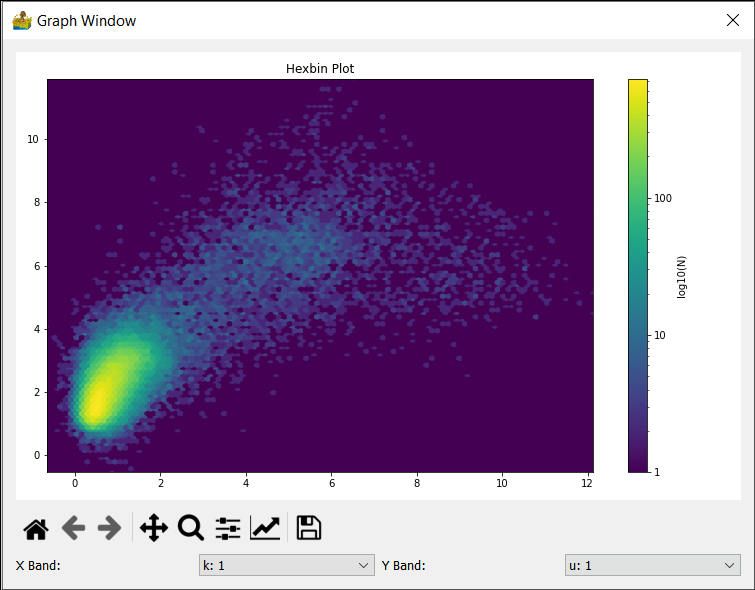
Hexbin plot window.#