

Show Profiles on a Map#
This module displays line data in in map form. The line data is displayed in black, superimposed over the x,y location of the data (gray line). This is only applicable to point data collected along lines.
The interface has the following features:
Show Line Labels - Select to show the line number at the end of a line.
Column - The channel to display.
Scale - This allows the user to change the anomaly scale.
Standard image display settings that allow the user to zoom into specific areas of the image, move the zoomed in area around, return to the full image, save the image, etc.
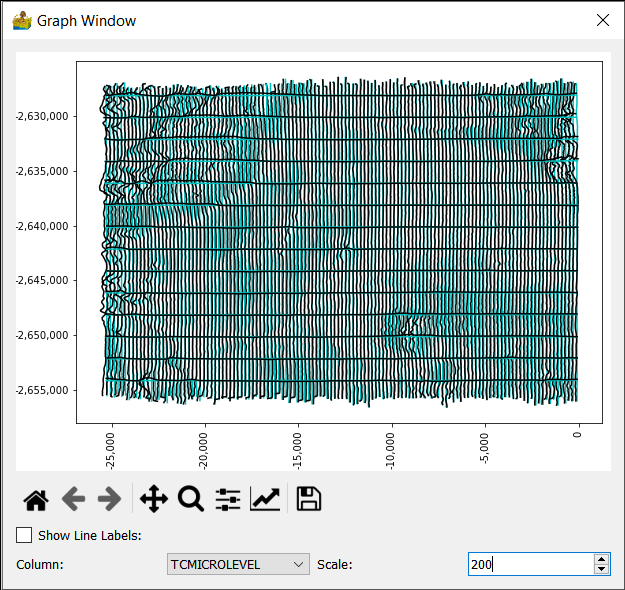
Show Profiles on Map interface. A zoomed in section shows the selected channel in black superimposed on the positional data in blue.#