

Show Class Data#
This provides a quick graphical representation of the output of the cluster analysis
The options on this interface are:
Bands - If the classification was done for a range of clusters the results for each number of clusters can be selected via the dropdown menu.
Standard image display setting that allows the user to zoom into specific areas of the image, move the zoomed in area around, return to the full image, save the image, etc.
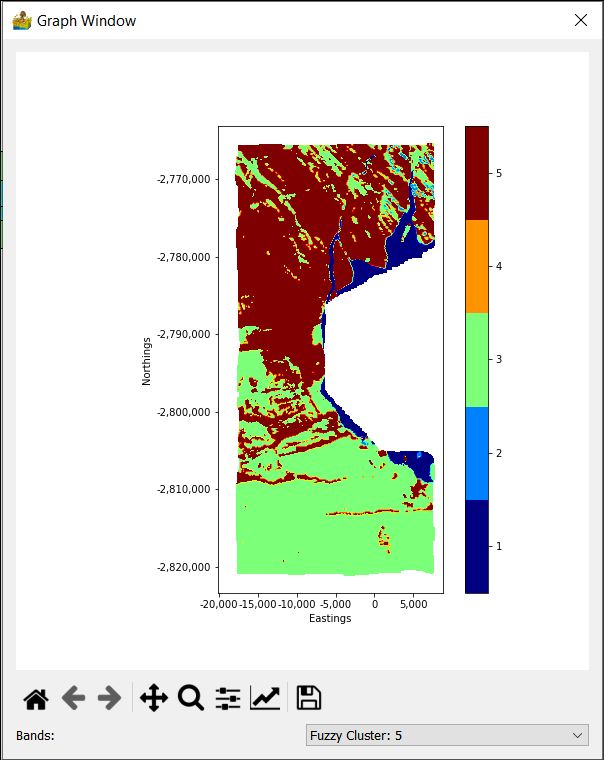
Show Class Data interface.#