

Show Temporal b-value Plots#
This allows for the calculation of the b-value over a number of events rather than over the complete list of events. The function sorts the events by date and the user selects the window size (number of events). The b-value is calculated over the window, and then the window is moved along by one event and the calculation is repeated. This shows how the b-value changes over time.
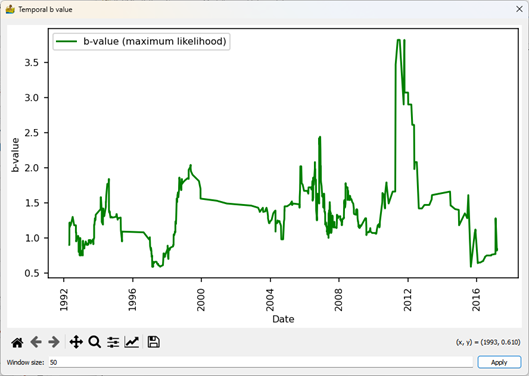
The Temporal b-value plot interface.#