

Plot Correlation Coefficients#
Correlation coefficients are popularly used to find relationships between different data types. It is best suited to point data sets.
The interface has the following features:
Style - Two colour modes are available:
Normal - here negative and positive correlations are mapped to colours.
Positive correlation highlights - This highlights positive correlation values above 50%.
In both cases, only the lower triangular portion of the heatmap is shown, since the upper triangular portion is a symmetrical duplication. This simplifies the final plot.
For a large number of channels, reading the values can be difficult. Hovering over a feature of interest displays the correlation coefficient between the two channels in the bottom right corner of the plot. The user can also zoom into the plot using the standard display settings.
Standard image display settings that allow the user to zoom into specific areas of the image, move the zoomed in area around, return to the full image, save the image, etc.
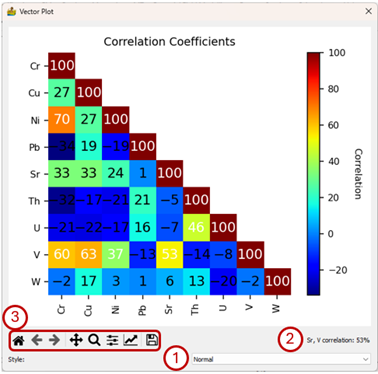
Correlation coefficient plot interface for vector data. in this case the style is “Normal”.#