

Show Raster Data (Simple)#
This is convenient image display for raster data. Only one band can be viewed at a time. The band can be selected for multiband data. For more display options, use the Show Raster Data (Advanced) module. The options on this interface are:
Bands - Select the band to be displayed.
Colormap - Select a colormap for the data display. The user can choose between Viridis, Jet, Gray and Terrain.
Standard image display setting that allows the user to zoom into specific areas of the image, move the zoomed in area around, return to the full image, save the image with the colour bar, etc.
Log Colour Scale - use a logarithmic colour scale.
Coordinate Display - show the coordinate of the image at the mouse pointer.
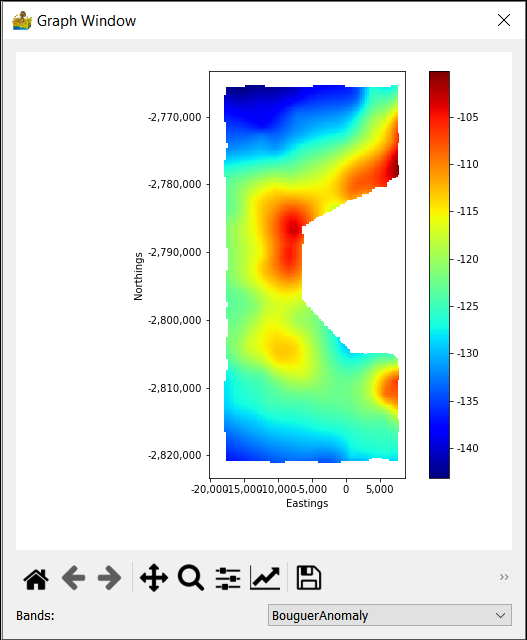
Show Raster (Simple) interface.#
In the specialised case where a section was gridded up using the Dataset Gridding module, the image display will be in units of distance down the section on the x-axis. Hovering over the image will give actual coordinates (as opposed to distance down the section) in the bottom right of the image.
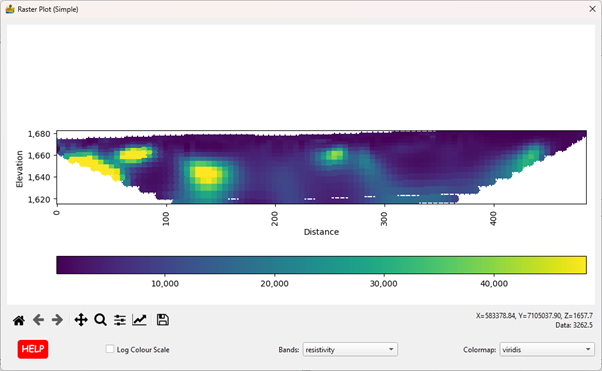
Section displayed on the interface.#