

Show QC Plots#
A series of graph routines were developed to assess the SEISAN catalogue data. The following graphs are available for QC purposes:
Events by Hour - Histogram
Events by Month - Histogram
Events by Year - Histogram
Number of stations - Histogram
RMS of time residuals - Histogram
ML vs Time - Scatter plot
ML vs Year - Scatter plot
b-value - Cumulative histogram and line
Error Ellipse
Error Ellipse (No depth errors)
GAP - Histogram
Longitude Error - Histogram
Latitude Error - Histogram
P-Phase Residuals - Histogram
S-Phase Residuals - Histogram
ML Residual - Plot with error bars
Time Residual - Plot with error bars
Wadati plot - Line and points
These graphs are accessible through a dropdown list in the graph window. For the graphs displaying error ellipses, an option is available to save the ellipses to a shapefile.
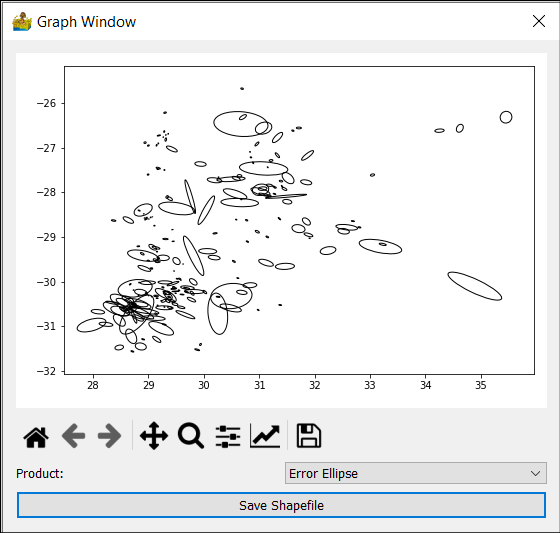
QC Plot window.#
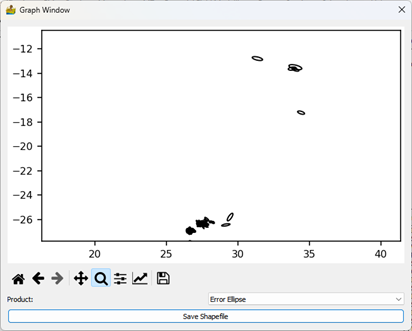
QC Plot window with the option of storing the error ellipses in a shapefile.#