

Cluster Statistics#
Cluster statistics show the central value of each cluster with respect to each band of the input data, as well as the associated standard deviation. The interface has the following features:
The bands of the input raster dataset form the column headings.
The classes resulting from the classification form the rows of the table.
Each cell contains the mean value and standard deviation of the class with respect to the input data band in the format Mean Value : Standard Deviation.
If the classification was done for a range of clusters, the user can select the number of clusters for which the statistics must be displayed.
Save – The table can be stored as a CSV file. If the classification was done for a range of clusters the statistics for all the cluster numbers are stored.
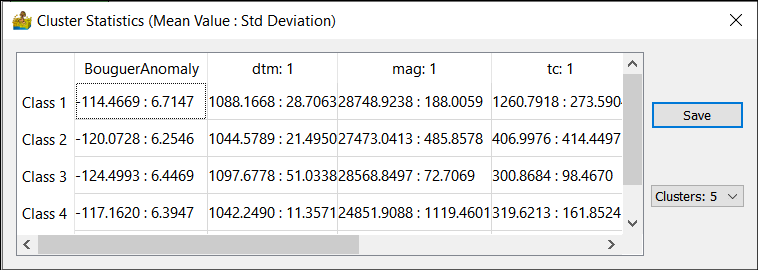
Cluster Statistics table.#