

Show Histogram#
This shows the histogram for a band of data. The options on this interface are:
Log Y Axis - By default the data are displayed on a linear Y-axis, but the user has the option to use a logarithmic y-axis.
Cumulative - The user has the option to display the data in a cumulative form. This is useful when trying to see how many values are above or below a certain threshold.
Bands - Select the band for which the histogram must be displayed.
Standard image display setting that allows the user to zoom into specific areas of the image, move the zoomed in area around, return to the full image, save the image with the colour bar, etc.
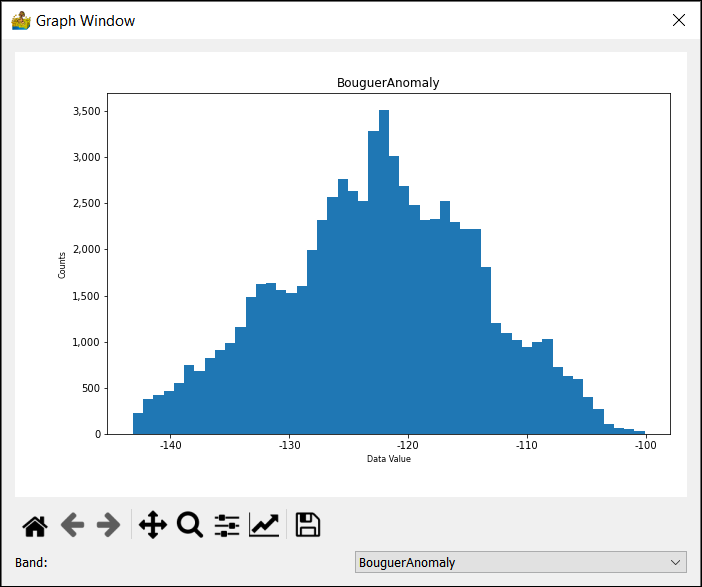
Histogram plot of a dataset.#