

Show Rose Diagrams#
This module calculates and displays rose diagrams. It needs as input vector data with line features (as opposed to point or polygon) which has been imported into PyGMI. The user can specify how features are defined, either one angle per feature defined by the start and end point of the feature, or an angle per segment in the feature. The number of angles in the rose diagram can be set as well. A map of the features colour coded is also displayed. Equal area rose diagrams can also be produced (Nemec, 1988; Sanderson and Peacock, 2020).
The interface contains the following features and options:
The rose diagram.
The line vector data coloured according to the colours of the wedges in the rose diagram.
The option to display an Equal Area Rose Diagram. The default setting plots an equal-radius diagram where the radius of a wedge is proportional to the frequency, whereas for an equal-area diagram the area of a wedge is proportional to the frequency (Sanderson and Peacock, 2020).
Rose Diagram Type - The user can specify how features are defined:
Average angle per feature - one angle per feature defined by the start and end point of the feature.
Angle per segment in the feature - each segment making up a feature is considered separately.
Value - The number of angles in the rose diagram.
Standard image display settings that allow the user to zoom into specific areas of the image, move the zoomed in area around, return to the full image, save the image, etc.
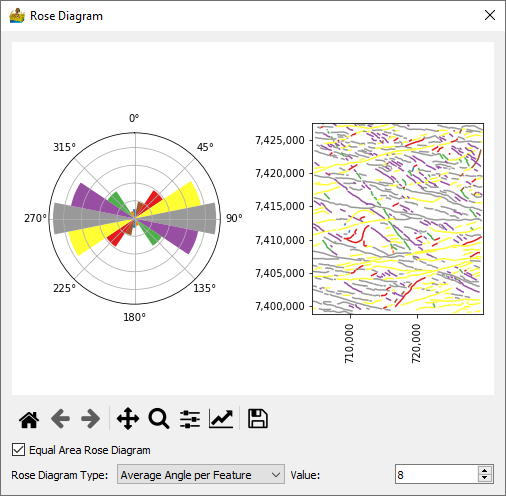
Show Rose Diagram interface for line vector data.#
References#
Nemec, W. 1988. The shape of the rose. Sedimentary Geology, 59, 149-152, https://doi.org/10.1016/0037-0738(88)90105-4.
Sanderson, D.J. and Peacock, D.C.P. 2020. Making rose diagrams fit-for-purpose. Earth-Science Reviews, 201, 103055, https://doi.org/10.1016/j.earscirev.2019.103055.