

Dataset Gridding#
This module grids data using nearest neighbour, linear, cubic (all from SciPy) or minimum curvature (Briggs, 1974) algorithms. The input is a point or line or vector dataset, imported from the vector menu. Note that the x and y columns are defined when importing the line or point data.
It is also able to output the grids as either rasters, sections or 3D voxel grids. Rasters are conventional grids with an X and a Y coordinate. Sections are grids of distance along a profile versus depth. Voxel datasets are 3D and have X, Y and Z coordinates.
The gridding options are:
Gridding Type - This can be Raster, Section or Voxel.
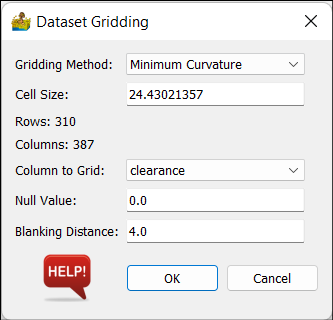
Gridding Method - This can be Nearest Neighbour, Linear, Cubic or Minimum Curvature. The latter fits a polynomial surface through the points and is best suited to more continuous or smooth data such as gravity and magnetic data (potential field data sets). It should not be used for digital terrain models or radiometric data.
Cell Size - This represents the size of a square raster grid cell, in the units of the grid (normally metres).
Column to Grid - This allows you to select the Z column to grid.
Null Value - Data values that the user wants to mask.
Blanking Distance - This is a distance, in cells, from data points beyond which the grid will be masked.
Z Coordinate Value - Column to use for Z coordinates. This is applicable to Section and Voxel datasets.
Line Number - Used for a Section, if a section is defined by line number.
DEM Grid - A Digital Elevation Model raster dataset, used in Voxel gridding to determine the top surface.
Dataset Gridding options for the Section gridding type.#
References#
Briggs, I. C., 1974, Machine contouring using minimum curvature, Geophysics vol. 39, No. 1, pp. 39-48