

Change Detection#
Change detection is an important technique used in the analysis of remote sensing data. Ordinarily, satellite data has a fixed number of bands (between 4 and 12 on average). These bands represent a light spectrum and can be utilised to study various terrestrial phenomena, from vegetation to minerals. The limits of the data are normally due to the number of bands in the data. One way to overcome this is to examine the temporal dimensions of the data. By studying the change in the data across multiple scenes, we can leverage more information.
Change detection relies on the changing nature of the earth. This can be from extreme environmental disasters such as fires and landslides, or as simple as studying the effect a seasonal change has on the target being studied, land use and land cover change and mineral outcrops by using change detection as a process of elimination (Cole and Coetzee, 2022).
The Change Detection menu has two functions, namely Calculate Change Indices and View Change Data.
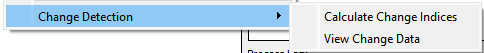
Change Detection functions.#
Calculate Change Indices#
Change Detection Indices give a measure of change in an area. The input to this module is a list of datasets loaded using the batch importer. It does not have to be satellite images, but can be derived products such as classifications. Each dataset must have an associated date. The import tool for satellite scenes should assign a date automatically, but should a manual date need to be assigned, this can be done within the metadata context menu.
The following indices can be calculated:
Difference - Calculates the difference between two dates (latter date minus earlier date).
Mean - Average pixel value image over all dates.
Standard Deviation - Shows pixel variation through standard deviation.
Coefficient of Variation - Measure of variation, taking mean into account.
Spectral Angle Mapper - Find spectral angle between two scenes.
Note that for Difference and Spectral Angle Mapper calculations only two datasets are allowed.
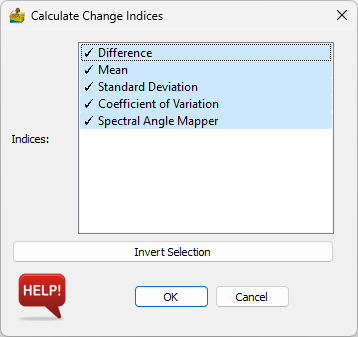
Change indices that can be calculated.#
The result is a multiband raster file consisting of all the indices calculated for all bands. It can be exported by right-clicking on the Calculate Change Indices module and selecting Export Raster Data.
View Change Data#
Visualising change is an obvious need for change detection since an end user often wishes to see the scenes in sequence, rather than in the form of an index. The viewer requires only a batch list coupled with associated dates for each scene (defined in the raster file’s metadata). The viewer loads in the scenes at a reduced resolution, suitable for a windows display. This increases speed, with the relevant section of the scene being reloaded upon zooming in. Because this viewer is dependent on reading constantly off a disk, slow image data formats are not supported. To optimise this, the viewer requires the data to be in GeoTIFF format. The main display also shows the date and time stamp for the scene.
The viewer options are:
Display Type - sets the image to be displayed, whether Single Colour Map, RGB Ternary or CMY Ternary.
Data Bands - Select the bands to be displayed.
Start Capture - The scenes can be exported to a GIF image, at the current resolution and zoom.
Scroll bar - Drag the slider to select the scene to display.
Previous Scene and Next Scene - Use these buttons to move forward and backward through the scenes.
Standard image display settings that allow the user to zoom into specific areas of the image , move the zoomed in area around, return to the full image, save the image with the colour bar, etc.
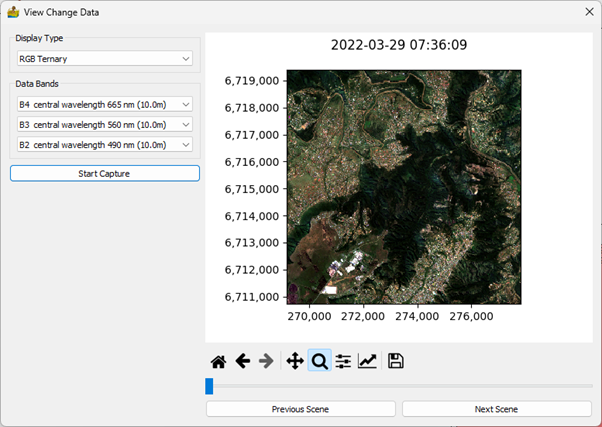
Change detection data viewer.#
References#
Cole, P., Coetzee, H., 2022, Innovative use of change detection in large numbers of satellite scenes, with geological applications, Quarterly Journal of Engineering Geology and Hydrogeology