

Show Spatial Variation of the b-value#
This allows for the calculation of the b-value over an area rather than over the complete list of events. The function sorts the events proximity to a grid value, defined in terms of latitudes and longitudes, only using grid values with more than a predefined number of events. Each grid value has its b-value calculated. This shows how the b-value changes over an area. Only local magnitudes are used for the calculation.
The calculation of the variation is based on the description by Wesseloo (2014), although thee b-value calculation uses the CMAX method (Mignan and Woessner, 2012)
The options are:
Grid spacing - the grid spacing in decimal degrees.
Search radius - The maximum radium from each grid point to search for events
Minimum number of events - The smallest number of events to use for the b-value calculation at a grid point.
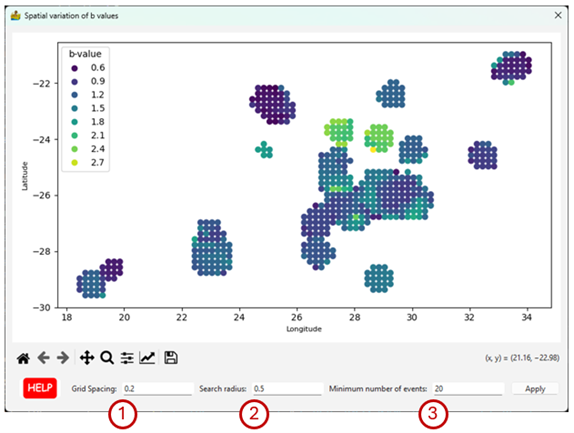
The Spatial variation b-value plot interface.#
References#
Wesseloo, Johan. (2014). Evaluation of the spatial variation of b-value. Journal- South African Institute of Mining and Metallurgy. 114. 823-828.
Mignan, A. & Woessner, Jochen. (2012). Estimating the magnitude of completeness for earthquake catalogs. Community Online Resource for Statistical Seismicity Analysis. doi: 10.5078/corssa-00180805.